Six Sigma in Plain English
I have been part of several Six Sigma projects in some capacity. One thing I’ve noticed is that Six Sigma is rarely explained to the team.
Especially in manufacturing, more and more companies and people are getting involved in Six Sigma, each team has at least one champion who is the Six Sigma expert on that team. But what about the rest of the team? Without knowing what Six Sigma is about, their contribution to the project may be less. It can be a complicated-sounding, technical thing to explain. One definition I came across on the web of Six Sigma came from Wikipedia
The term Six Sigma originated from terminology associated with manufacturing, specifically terms associated with statistical modeling of manufacturing processes. The maturity of a manufacturing process can be described by a sigma rating indicating its yield or the percentage of defect-free products it creates. A six sigma process is one in which 99.9999998% of the products manufactured are statistically expected to be free of defects (0.002 defective parts/million), although, this defect level corresponds to only a 4.5 sigma level.
Here, i will try explaining Six Sigma in plain english without getting too caught up in technical detail. Statisticians and black belts, feel free to tear my explanation apart and poke holes in the theory, but remember the objective here – this is not a tutorial and I want to keep it light (or at least as light as Six Sigma gets!)
I use two examples to keep this clear in my head……

Meet Peter. Everyday when Peter gets home from work he parks his car in the middle of his garage. So, if Peter came in from work one day and parked slightly off-center, it’s not a major issue because he has the flexibility to do that.

Now, imagine our fictitious parker, Peter owned a wider car in the same garage.
Now as long as he parks dead-center he will be okay, but if one day he is even slightly off-center that could be damaging.
So, what does Peter the parker have to do with Six Sigma?
If we turn the garage walls into limits (USL and LSL for Upper and Lower Specification Limits) and the car itself is a normal curve we get the following two charts (left is the first example, and right is the second example with less room).

We want to keep our curves within our limits (the LSL & USL, or garage walls). As you can see, in the first example this is where Peter had plenty of room to park and if he was off-center it was no problem. The second curve shows Peter in the wider where if he goes off-center he is in trouble.
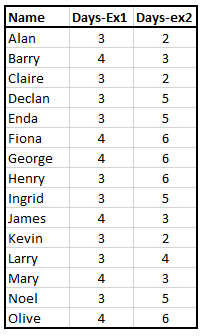
To demonstrate this further, using the examples of an expense claims process. Our customers are people submitting expenses to us for payment. They expect to be paid within 7 days. Our LSL is 1 day and USL is 7 days, ie, they want to be paid between 1 and 7 days.
Just looking at the second column of numbers (headed Days-Ex2) you can see that all our employees were paid within the 7 days which was their requirement. Does that mean that there are no issues and we don’t need to work on this process?
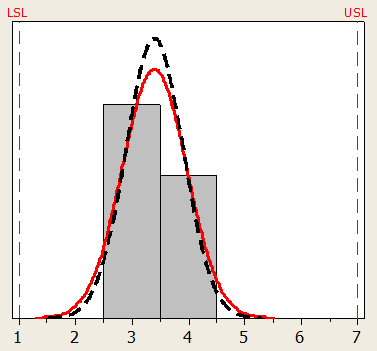
If we this is put on a graph, the LSL is 1 day, USL is 7 days and our curve is drawn around our observed results we get this

Statistically, based on capability and variation of this claims process for every million claims, over 57,000 will be outside our customer’s requirements – see the ‘tails’ of our curves which pass outside our limits (or garage walls).
Now if we plot the first column of numbers (Days-Ex1) in which all our sample claims are paid in either 3 or 4 days we get this
There is a lot less variation in our process, here for every million claims processed, only a small number will be outside the customer’s requirements.
As you can see, variation in processes increases the chances of defects. To achieve a Six Sigma standard, the process reduces the variations in process to 3.4 defects per million opportunities.
Roadmaps
The two main ‘roadmaps’ for Six Sigma are DMAIC (Define Measure Analyze Improve Control) and DMADV (Define Measure Analyze Design Verify).
In both cases you see DMA.
Without Defining a problem and the scope of the problem we don’t know what we need to work on, our project could last forever and we have nothing to focus on. How are we supposed to know our customer requirements? How do we know if the project is successful or not?
Without Measuring our baseline and future results how do we know that we have improved anything.
If you can not measure it, you can not improve it – Sir William Thompon Lord Kelvin
The root causes and sources of variation needs to be identified and this is done by Analysing our data.
The more you understand what is wrong with a figure, the more valuable that figure becomes – Sir William Thomson Lord Kelvin

So, there you have it, my attempt at explaining Six Sigma in plain english. I haven’t gone into the benefits, history, formula, tools used, etc. The aim here is to take what can be a technical meaning and put it in english, or at least show how I wrap my head around it.
