OEE Solution – Querying Various Sheets
In this post we will pull together formulas that we’ve seen in these posts
- Formula to get first, second and third highest values
- Formula to get last row number
- http://blog.thejaytray.com/excels-indirect-function/
- Data Validation Lists
- COUNTIF Function
Before continuing, if you are not familiar with the above posts or functions I would recommend reading them. Although I will include images with the functions used, I will not be going into too much detail explaining the function in this post.
We will create a file that will summarize data from other sheets to match our selected criteria.
If you have never needed a file like this, or had a problem that could be solved with a file like this, then this post might seem a bit odd…. however, if you have ever needed a file like this, for whatever reason, then I hope this makes sense and you find it useful.
OEE Example – Printer/Scanner Errors
I first had to create a file like this for OEE analysis – this file would read output from a few machine error logs which included fault details and i had to summarize this data by the number of occurrences of each error code and how long the machine was down due to each error code.
I was then asked to further improve the file by adding the option for a user to select a day, shfit and machine combination and have the file retrieve the summary just for that combination.
We are going to create a file in this post that will do the same – in reality, the file I actually created was more complex, but as it was specfiic to a certain type of machine and manufacturing environment, I don’t think it would be beneficial to replicate that file here, instead I will aim to keep the file created here as generic and reusable as possible.
I will use the example of an office with 2 copier/printers (MFDs or Multi-Function Devices for the rest of this post), I think most of us know MFDs and have been frustrated wtih them at some point, so some of these errors might be something we are already familiar with.
- Copies are too dark/light
- Job queue issues
- Lines on paper
- Low/no ink
- No network connection
- Paper jam
- Poor print quality
- Power outage
- Smudged ink
- Wrinkled paper.
The final solution will look something like this.

OEE File Set-Up
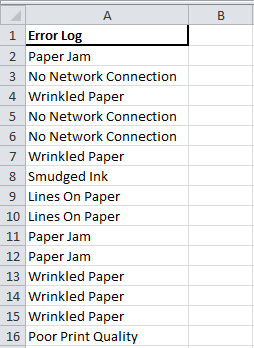
There will be a sheet for each day and each MFD (called A and B here).
![]()
I have randomly copied and pasted in some of the errors to each page, varying the order, number of errors and number of times each error appears.
OEE Summary Sheet Set-Up
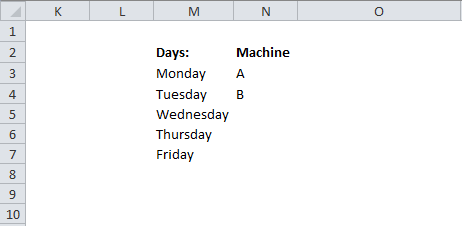
When you have the error pages set up for each day and MFD combination, then you can add a summary sheet and set it up like this.

In column M we will list the work days and in column N we will list the machine names (A & B).
These will be used in our data validation drop down lists – note that you can type the list of data validation criteria directly into your validation set up, but I’m using the range in my list criteria here as most people I deal with seem to be more comfortable with this option.
Data Validation
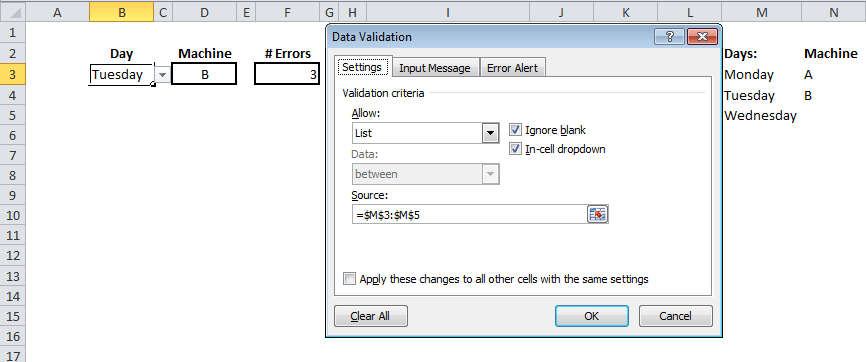
In cells B3 and D3 we will add data validation.
The validation criteria will be a list in both cases and the source will be our list of days and machines.
In column O we will ad the list of errors.
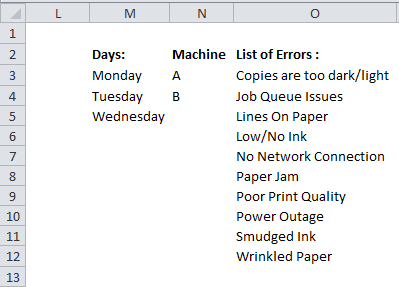
If you look back at the first image in this post showing the final file, you will see that all these columns with background data will be hidden in the final version.
COUNTIF
We are going to create a COUNTIF function that will change based on the day and machine combinations selected.
Before I get into formula like this, I like to set on simple formula first and then add to it.
In column P let’s assume that Monday and machine A are being queried.
Enter a COUNTIF function to count how many times each error appears in the Monday A sheet.

INDIRECT Function
Now that we have a COUNTIF function set up, let’s amend it so that it will refer to the relevant sheet depending on what day and machine are selected from the drop down lists in cells B3 and D3.
This is where we use the INDIRECT function to put together a string of text that will become a reference that Excel understands.
Our original COUNTIF function referred to the sheet name as ‘Monday A’ – we are going to refer to it by referencing the day selected in B3 and the machine selected in D3.

COUNTIF & RANK
Next we are going to set up our file to rank the errors by frequency.
In column Q, enter a formula to assign a number for ranking to the No. Errors in column P.
If a number is duplicated, we will add to that number to make it unique.
In the example below, the first instance of 2 in column P is 2 in column Q and the second instance of 2 in column P is assigned 2.2 in column Q.
This is to avoid any duplicate values being ignored or left out of the final analysis.

Again, if you’re not sure what is being done here, maybe read back on the posts linked at the start of this post to review some of the formulas on their own.
Now in column R, you can rank the results from column Q.
![]()
INDEX MATCH, VLOOKUP & Conditional Formatting
In cells H3 to H12, enter the numbers 1 to 10.
In cells I3 to I12, enter an INDEX MATCH function to look up the issue for each rank 1 to 10l

In cells J3 to J12, enter a VLookUp function to retrieve the number of occurrences of each issue in column I.

Now for cells H3 to J12, set the text color to white – you won’t see any of your text now.
Add a conditional formatting rule to this range.
You are going to use a formula to determine which cells to format.
Your formula will check where J3>0 (i.e. J3 is not blank) and you will format the text to be black font.

What does this do?
If there is an issue to be ranked, the text will be black and you will see the result, otherwise the field will appear blank – in fact, the text will be white on a white background.
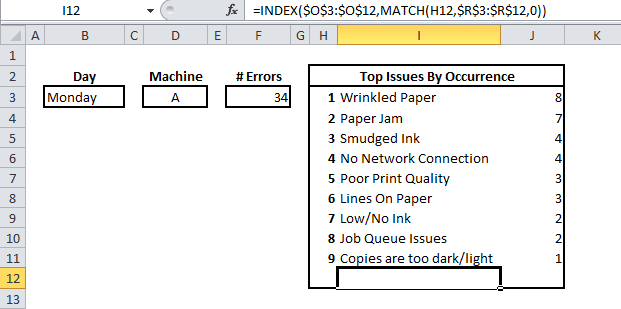
In the example below, there were only 9 issues on this MFD/Day combination, so issues 1 to 9 are shown, but the row that would contain the 10th issue appears blank, but you can see the formula bar is showing our INDEX MATCH function.
You can hide from column L all the way across to the right and from row 15 all the way down to the bottom.
This just shows the user the section you want them to see.
There you have it!
The starting blocks for a complete OEE analysis file.
The last file I had to create like this was extremely complicated with thousands of rows of data for each day/machine combination and there were other considerations too.
For example, if we stick with the idea of our printer/MFD.
If there is a paper jam, it reports that as an error.
If an open tray was also a reportable error, then when a person tries clearing the paper jam, they will have to open the tray.
In this case, there was only one error, the paper jam, but two errors are reported because the tray was opened.
How did I get around this?
The reported errors all included the time of the error happening and being resolved.
The OEE file was set up to ignore certain errors (like open trays) if they happened after another error and were resolved before or around the same time as another error.
As well as reporting most frequently occurring errors, i have set up OEE files reporting the top 10 errors by downtime, other things like output, etc. an also be analysed as long as the raw data is available to be analysed.
As long as the raw data is available, this file type of template should be flexible enough to retrieve information once it is set up correctly.